

Since early March 2026, when a military conflict escalated in the Middle East, gold has fallen by about 20% (and at one point — by as much as 25%).
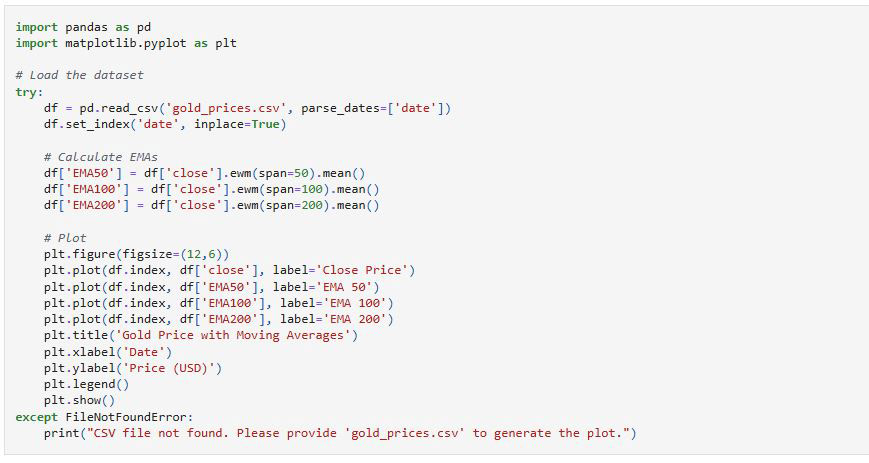
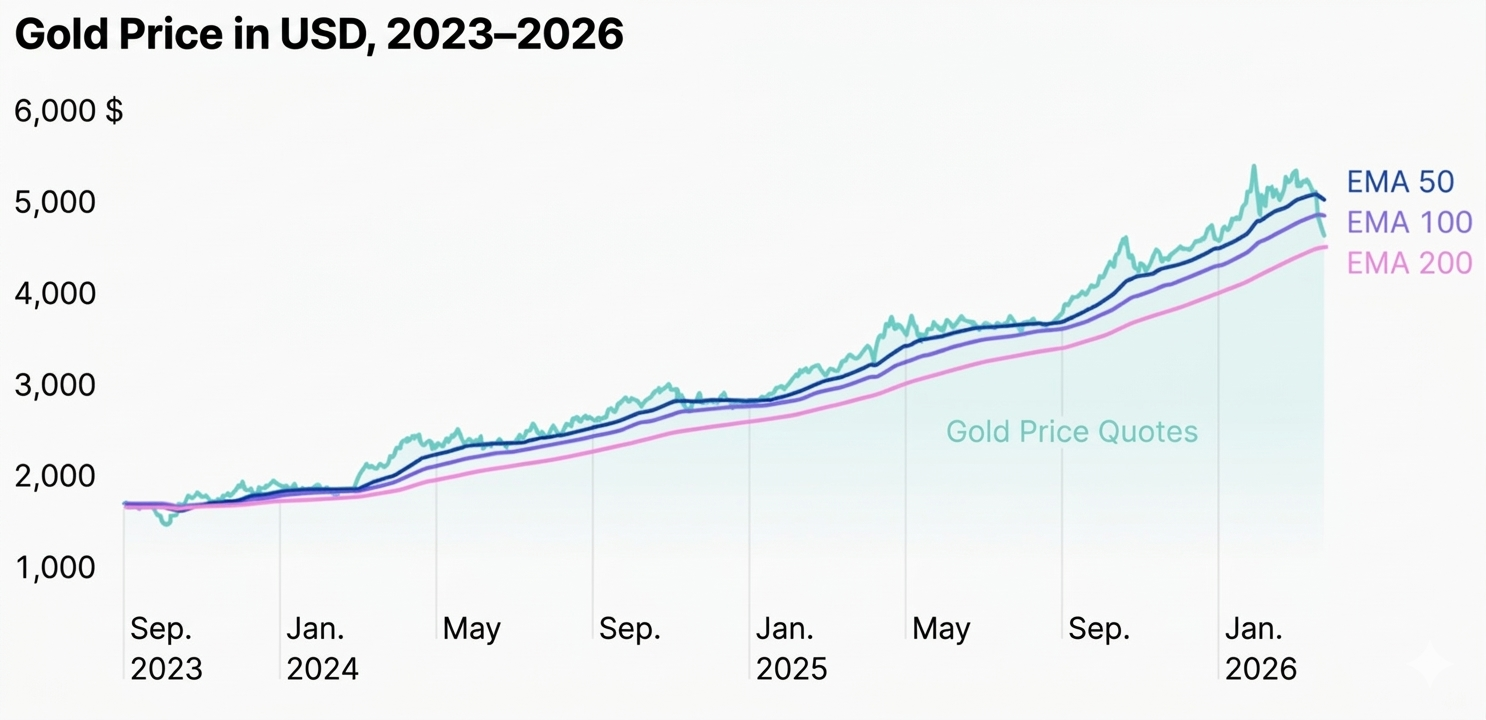
The daily chart shows that as of late March 2026, gold is still within a long-term bullish trend — meaning the asset is in a growth phase. The current drop is more of a correction. Prices have broken below the 50-day and 100-day EMAs and are approaching the 200-day EMA — a significant trend level. According to the RSI indicator, the asset is in the oversold zone.
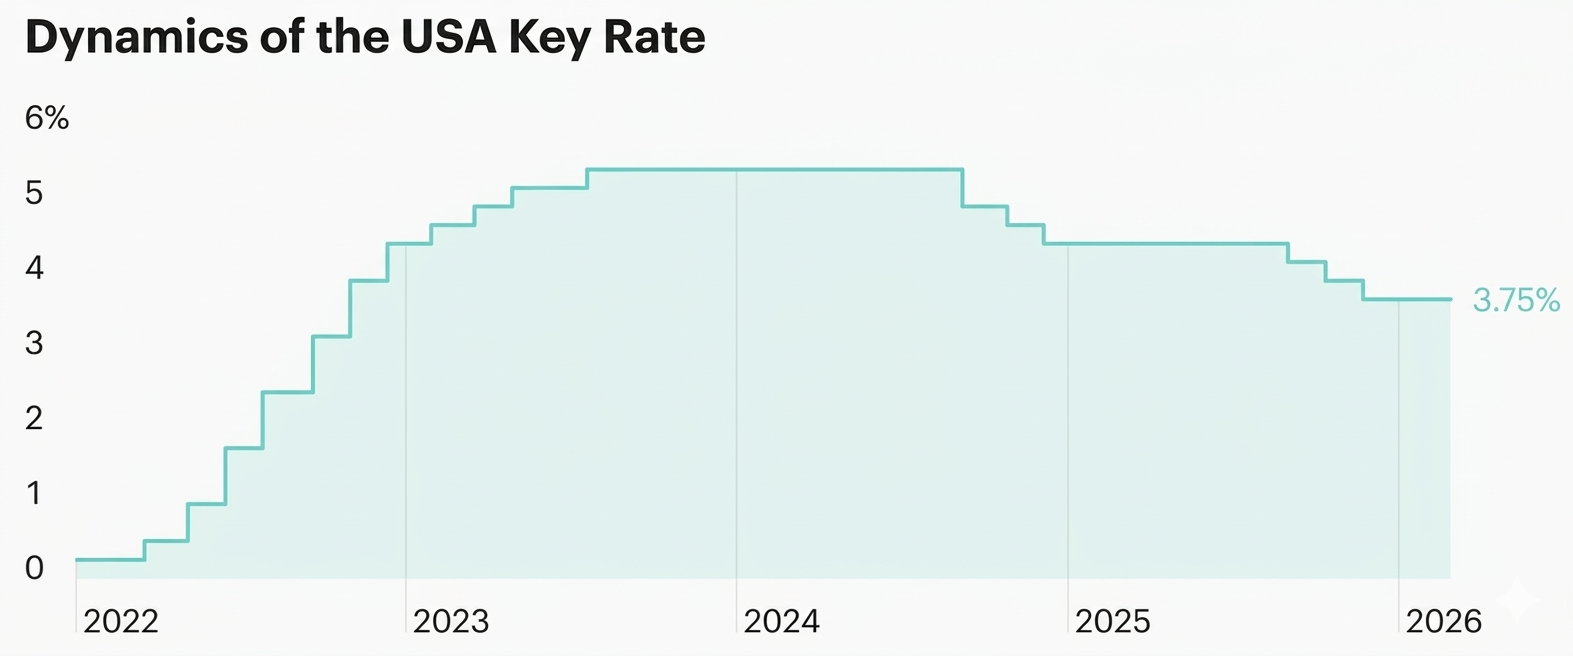
The Fed aims to reduce the key rate to 2%, but the process has dragged on. While inflationary pressure persists, the rate is kept high.
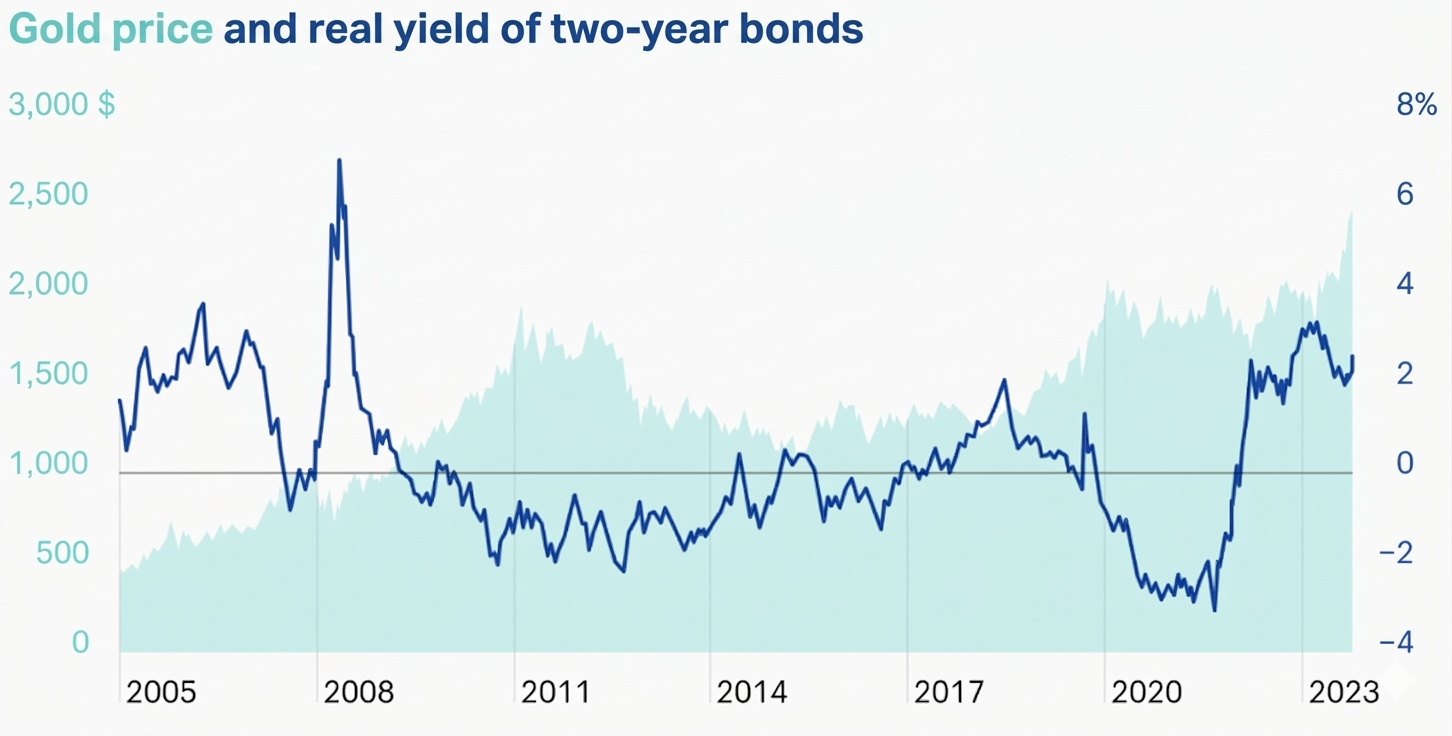
When the real yield on two-year bonds goes negative, investors essentially incur losses and move to alternative instruments like gold. Conversely, when the yield relative to inflation is decent, investors prefer to stay in bonds.
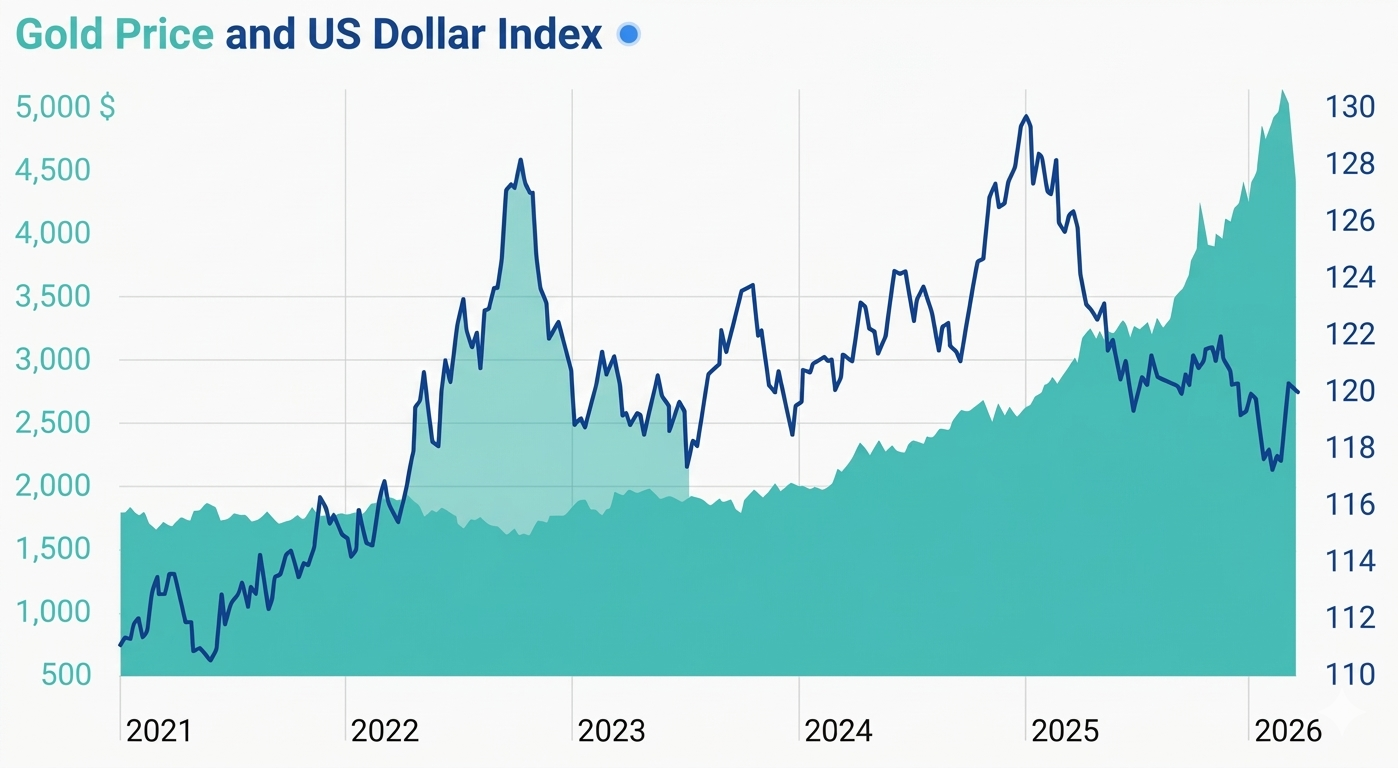
Correlation of gold price with the dollar over a five-year period — showing the inverse relationship.
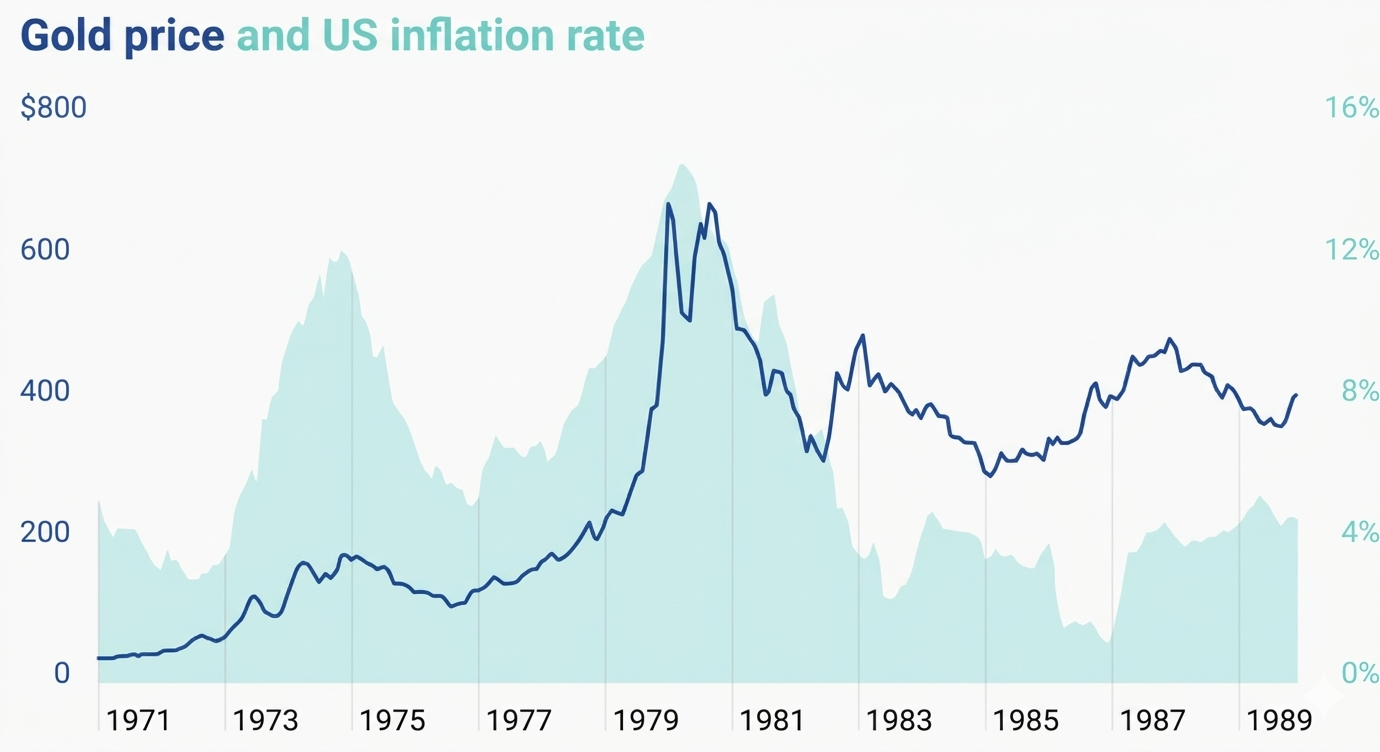
In the mid-1970s, inflation soared, and the price of gold rose by 550%: from 100 perouncein 1976 to 650 by 1980.
1990 Gulf War
2003 Iraq War
Interest rate: ~3.5–3.75%
→ Real yields remain positive
Several scenarios are possible:
Continued Pressure (Base Case)
High real rates persist.
Dollar remains strong.
Dollar weakens.
Conflict intensifies dramatically.